Short-term variations of the inner radiation belt
Zou Hong1, Li Chenfang1, Zong Qiugang1, George K. Parks2, Pu Zuyin1, Chen Hongfei1, Xie Lun1, Zhang Xianguo3
Institute of Space Physics and Applied Technology, Peking University, Beijing, China.
Space Science Laboratory, UC Berkeley, Berkeley, CA 94720, USA
National Space Science Center, Chinese Academy of Sciences Beijing, China
Long-term variations of South Atlantic anomaly (SAA) are generally derived by fitting a Gaussian-like function to an averaged distribution of the proton flux at a certain altitude accumulated over time periods for a month or longer. These data do not show the short-term variation of SAA arising from geomagnetic storm effects whose time scale is less than a month. To investigate the short-term variations, the features of SAA for the high-energy protons detected by NOAA Polar Orbiting Environmental Satellites during 1998–2008 have been investigated with a 5 day running average method. It is found that the two SAA parameters for three proton channels reflect the maximal proton flux in SAA and the extension of SAA decreases several percent during geomagnetic storms. Possible reasons for the decreases of the two SAA parameters for high-energy protons are discussed. Proton losses at the outer boundary of the inner radiation belt can be explained by the field line curvature scattering mechanism, while the decrease of the proton flux near the center of SAA is probably caused by the enhanced neutral atmospheric density during geomagnetic storms. The study of the behavior of high-energy protons in SAA is useful for understanding of storm time and long-term variations of the radiation environment near Earth and for constructing dynamic radiation belt models.

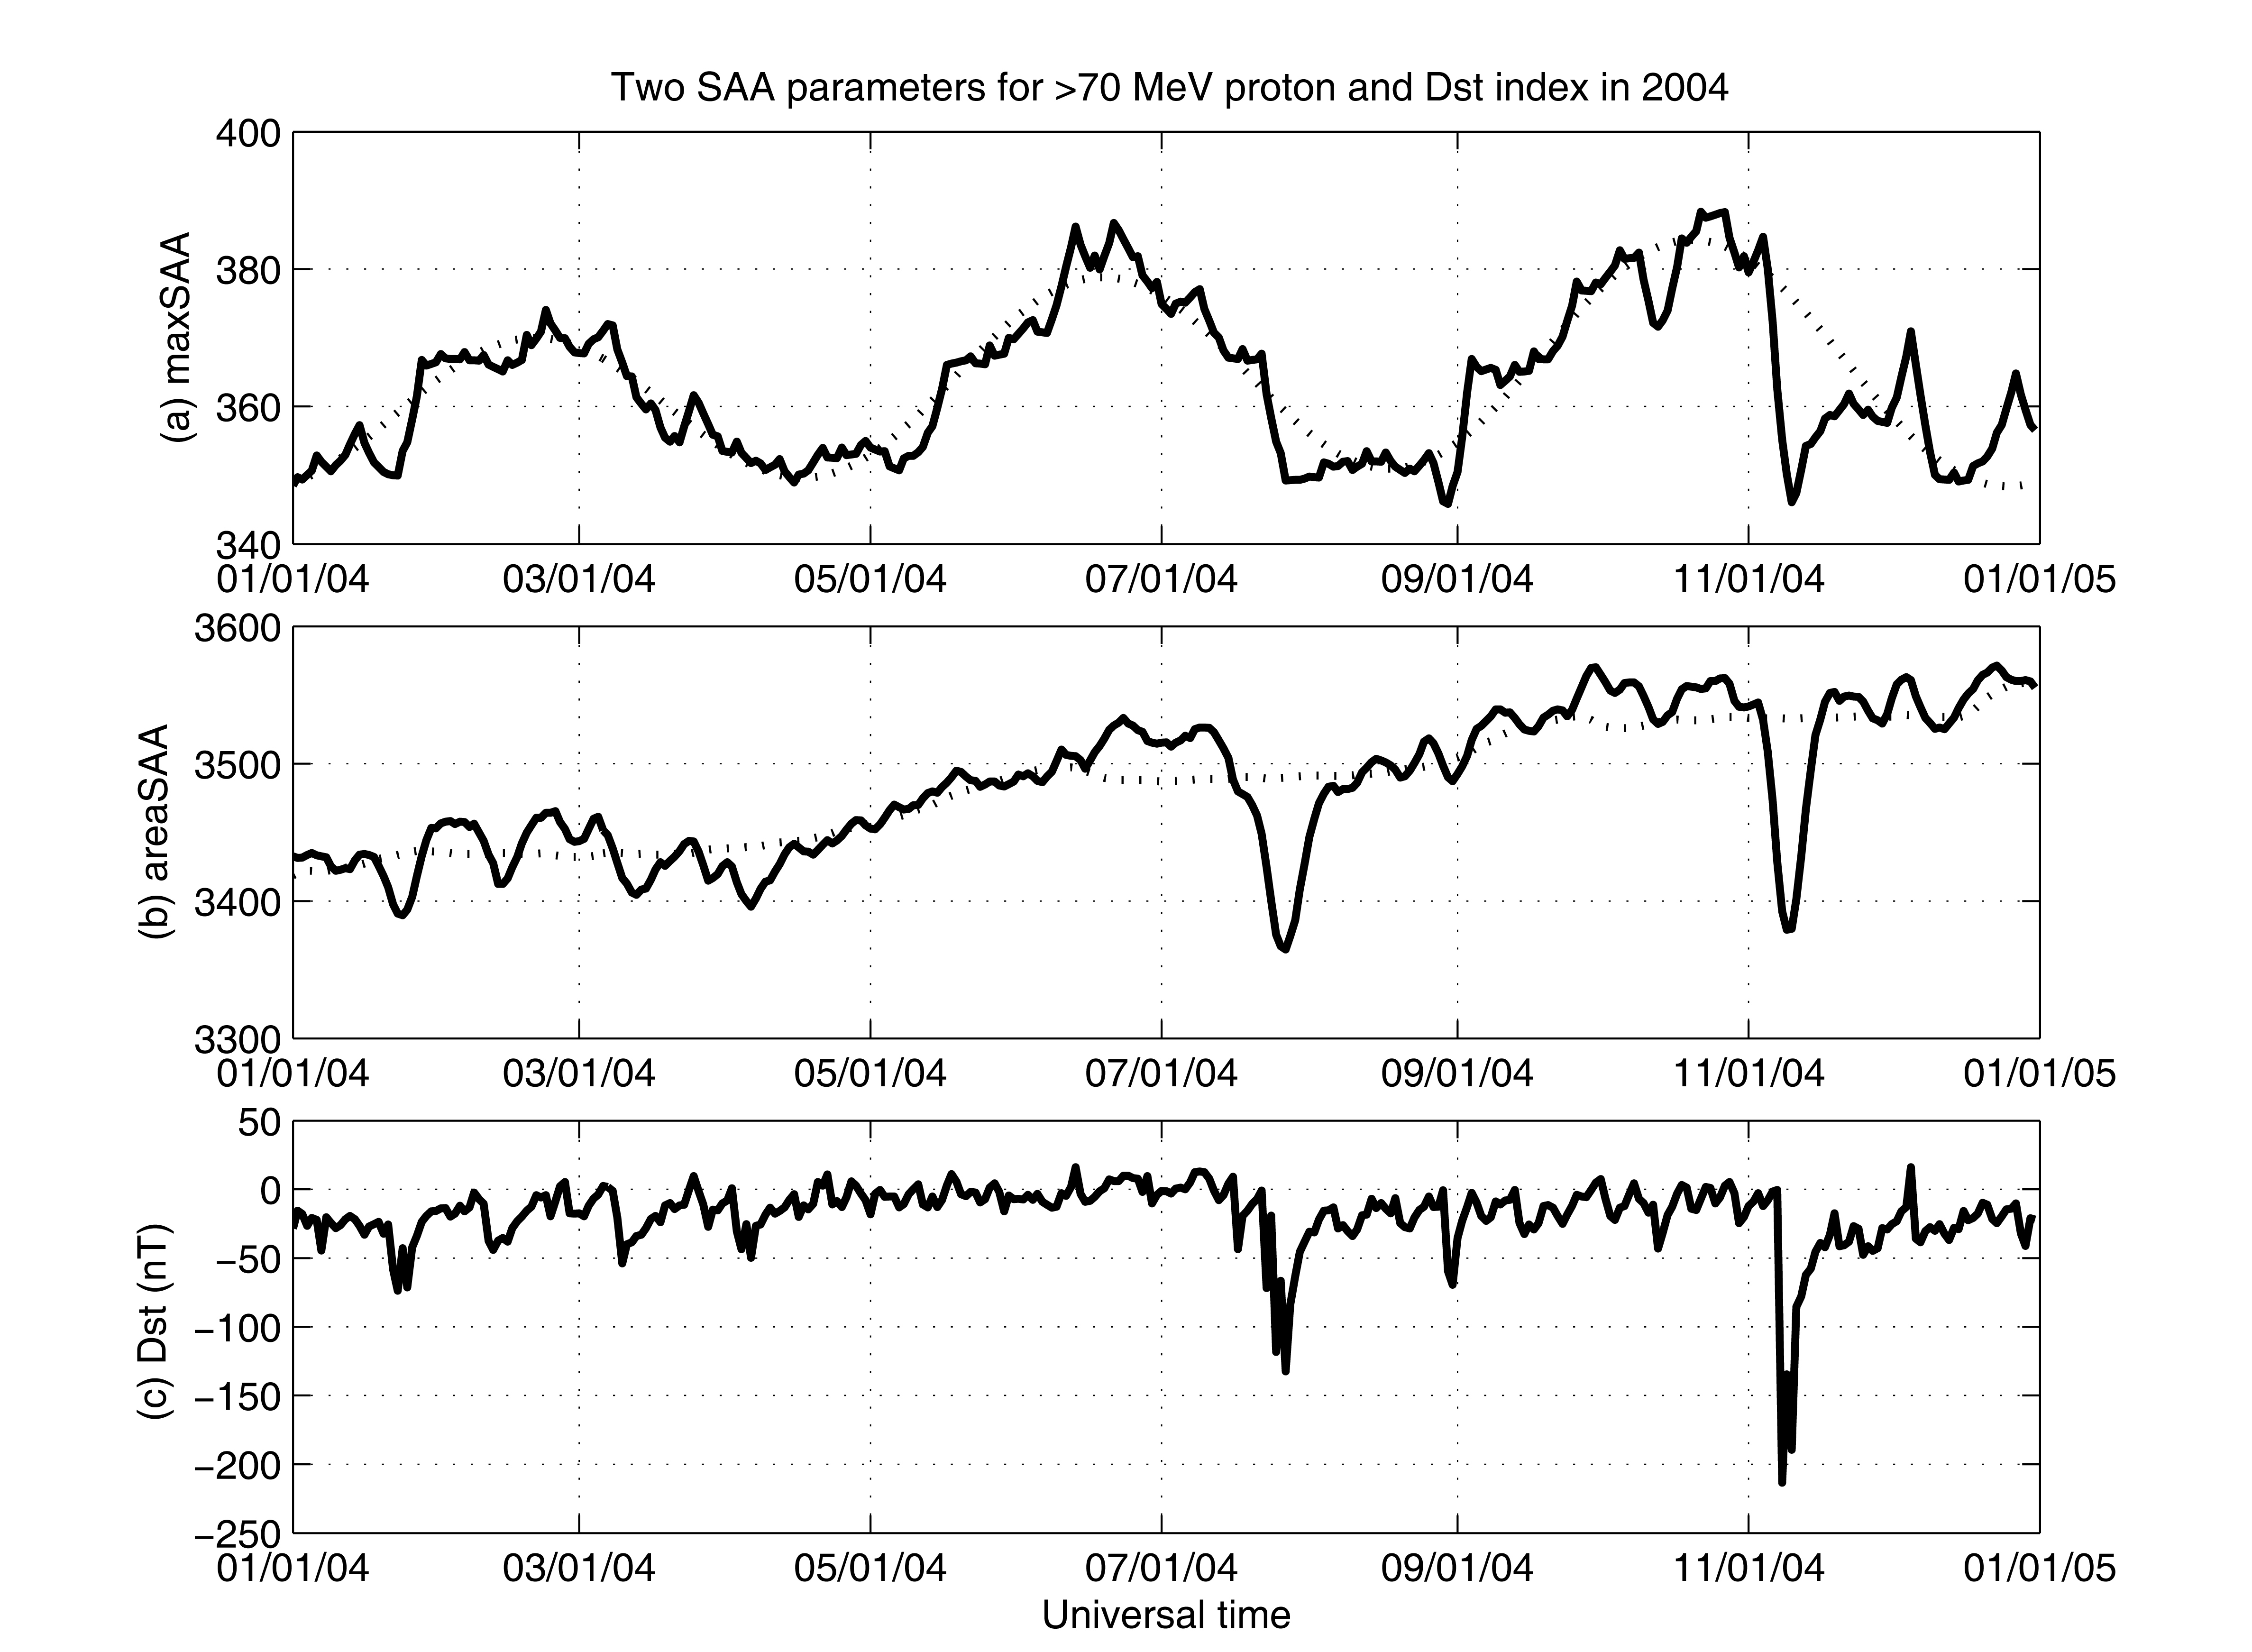
The 5-point (5-day) running averages of ‘maxSAA’ and ‘areaSAA’ for >70MeV protons measured by NOAA-17 in 2004, along with the daily Dst indices. The solid lines in panel (a) and (b) are the temporal variations of the ‘maxSAA’ and ‘areaSAA’, and the dotted lines show the best fit of the 120-day variations of them. The unit of ‘maxSAA’ is protons/cm2/s/sr and the unit of ‘areaSAA’ is the number of the area cells of 1°´1° square.

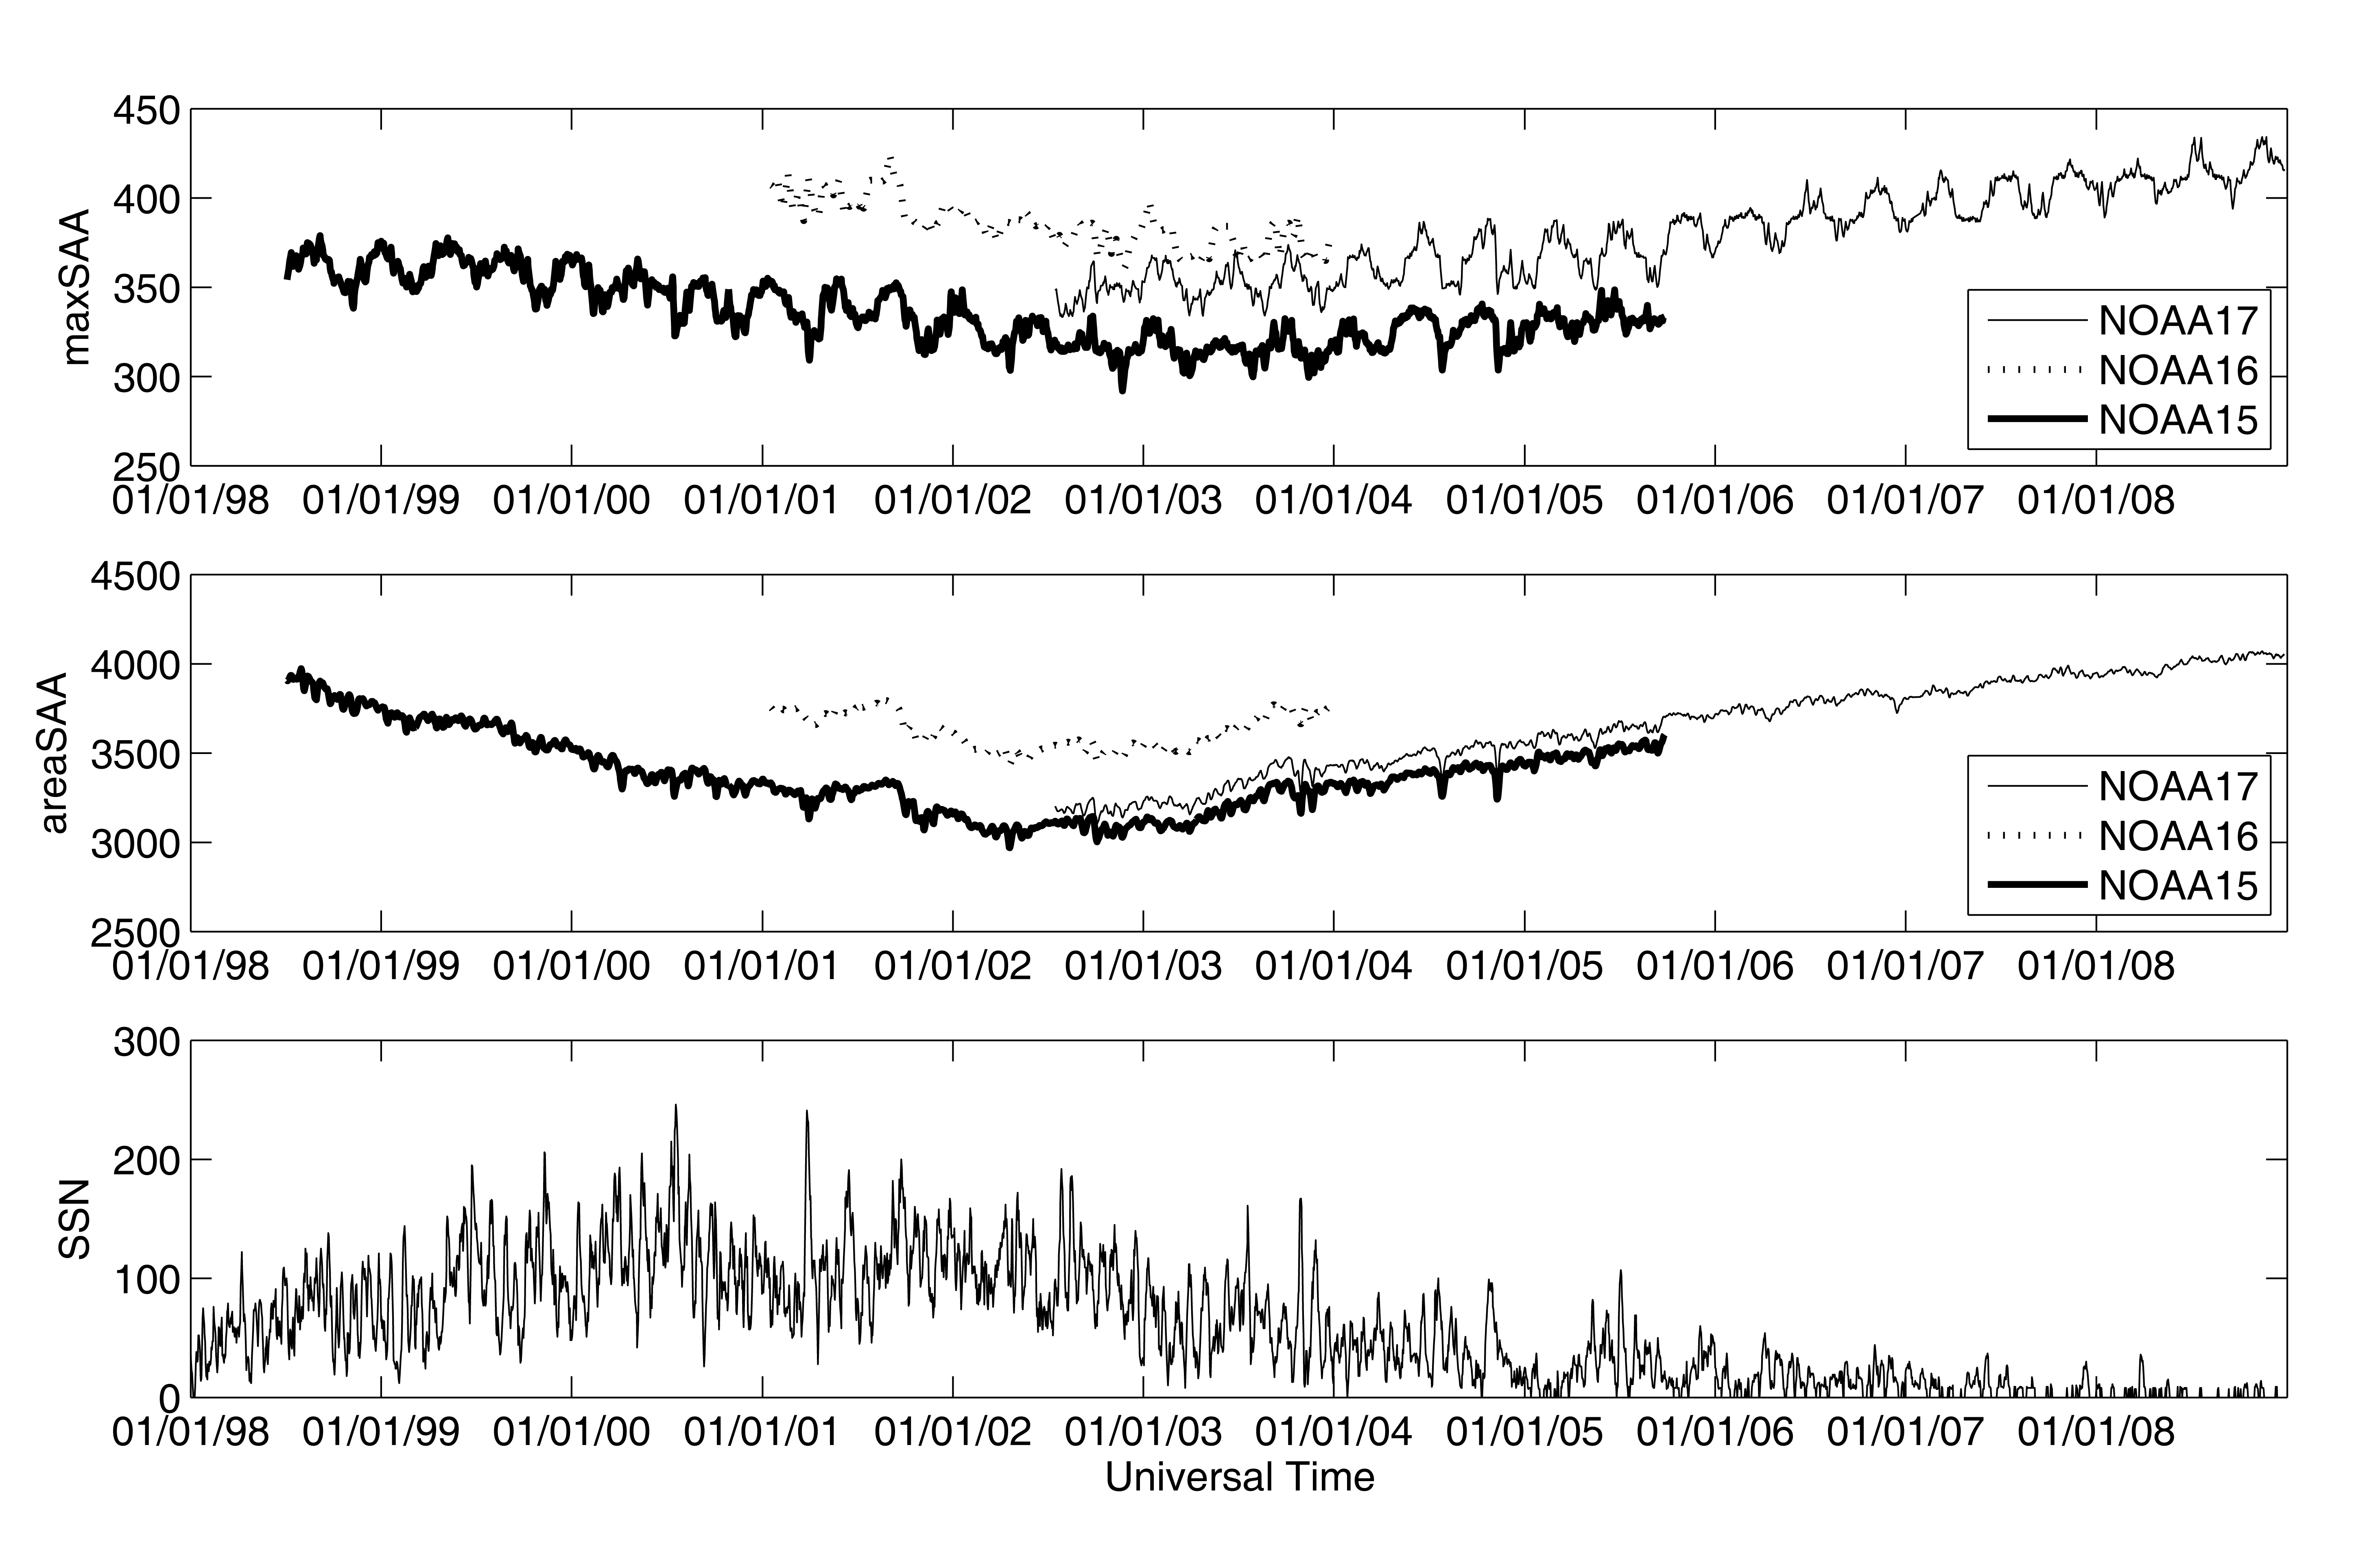
Long-term variations of the 5-day running averaged ‘maxSAA’ and ‘areaSAA’ of >70MeV protons observed by NOAA-15, -16, -17 during 1998-2008, along with the sunspot numbers. The units of ‘maxSAA’ and ‘areaSAA’ are same as those in Figure 4. Note that the orbit of NOAA-16 is about 40 km higher than NOAA15 and NOAA17. Therefore, ‘maxSAA’ and ‘areaSAA’ observed by NOAA-16 are slightly larger than those of NOAA15 and NOAA17.
This work is supported by the NSFC grants 41374167, 41074117 and 41374166.
Zou, H., C. Li, Q. Zong, G. K. Parks, Z. Pu, H. Chen, L. Xie, and X. Zhang (2015), Short-term variations of the inner radiation belt in the South Atlantic anomaly, J. Geophys. Res. Space Physics, 120, doi:10.1002/2015JA021312.
